Test Suite - Performance: Difference between revisions
(Show how to get boot time) |
(drop user@0) |
||
| (9 intermediate revisions by the same user not shown) | |||
| Line 1: | Line 1: | ||
= | = Software - what is run by each test = | ||
== Boot the VMs == | |||
Before a test can be run all the VMs are (re)booted. Consequently one obvious way to speed up testing is to reduce the amount of time it takes to boot: | |||
* make the boot faster - it should be around 1s | |||
* boot several machines in parallel - however booting is CPU intensive (see below for analysis) | |||
To determine where a VM is spending its time during boot, use <tt>systemd-analyze blame</tt> (do several runs, the very first boot does extra configuration so is always be slower): | |||
<pre> | <pre> | ||
$ ./testing/utils/kvmsh.py --boot cold | $ date ; ./testing/utils/kvmsh.py --boot cold l.east 'systemd-analyze time ; systemd-analyze critical-chain ; systemd-analyze blame' | ||
virsh 0. | Mon 10 Aug 2020 09:10:06 PM EDT | ||
virsh | virsh 0.00: waiting 20 seconds for domain to shutdown | ||
virsh | virsh 0.05: domain shutdown after 0.5 seconds | ||
virsh | virsh 0.06: starting domain | ||
virsh | virsh 11.07: got login prompt; sending 'root' and waiting 5 seconds for password (or shell) prompt | ||
virsh 11.08: got password prompt after 0.1 seconds; sending 'swan' and waiting 5 seconds for shell prompt | |||
virsh 12.00: we're in after 0.3 seconds! | |||
[root@east ~]# systemd-analyze blame | [root@east ~]# systemd-analyze time ; systemd-analyze critical-chain ; systemd-analyze blame | ||
Startup finished in 1.270s (kernel) + 1.837s (initrd) + 4.448s (userspace) = 7.557s | |||
multi-user.target reached after 4.411s in userspace | |||
The time when unit became active or started is printed after the "@" character. | |||
The time the unit took to start is printed after the "+" character. | |||
multi-user.target @4.411s | |||
└─sshd.service @4.356s +52ms | |||
└─network.target @4.350s | |||
└─systemd-networkd.service @1.236s +196ms | |||
└─systemd-udevd.service @1.003s +229ms | |||
└─systemd-tmpfiles-setup-dev.service @869ms +102ms | |||
└─kmod-static-nodes.service @644ms +115ms | |||
└─systemd-journald.socket | |||
└─system.slice | |||
└─-.slice | |||
2.909s systemd-networkd-wait-online.service | |||
445ms systemd-udev-trigger.service | |||
443ms systemd-vconsole-setup.service | |||
229ms systemd-udevd.service | |||
209ms systemd-journald.service | |||
196ms systemd-networkd.service | |||
180ms systemd-tmpfiles-setup.service | |||
178ms systemd-logind.service | |||
... | 145ms auditd.service | ||
138ms source.mount | |||
124ms testing.mount | |||
115ms kmod-static-nodes.service | |||
111ms systemd-journal-flush.service | |||
110ms tmp.mount | |||
102ms systemd-tmpfiles-setup-dev.service | |||
99ms systemd-modules-load.service | |||
84ms systemd-remount-fs.service | |||
71ms systemd-random-seed.service | |||
58ms systemd-sysctl.service | |||
57ms dbus-broker.service | |||
52ms sshd.service | |||
50ms systemd-userdbd.service | |||
33ms systemd-user-sessions.service | |||
24ms systemd-fsck-root.service | |||
23ms dracut-shutdown.service | |||
21ms systemd-update-utmp.service | |||
13ms systemd-update-utmp-runlevel.service | |||
6ms sys-kernel-config.mount | |||
[root@east ~]# | |||
</pre> | </pre> | ||
== | == Run the Test Scripts == | ||
To establish a baseline, <tt>enumcheck-01</tt>, which pretty much nothing, takes ~2s to run the test scripts once things are booted: | |||
<pre> | |||
w.runner enumcheck-01 32.08/32.05: start running scripts west:west.sh west:final.sh at 2018-10-24 22:00:44.706355 | |||
... | |||
w.runner enumcheck-01 34.03/34.00: stop running scripts west:west.sh west:final.sh after 1.5 seconds | |||
</pre> | |||
everything else is slower. | |||
To get a list of script times: | |||
<pre> | |||
$ awk '/: stop running scripts/ { print $3, $(NF-1) }' testing/pluto/*/OUTPUT/debug.log | sort -k2nr | head -5 | |||
newoe-05-hold-pass 295.6 | |||
newoe-04-pass-pass 226.7 | |||
ikev2-01-fallback-ikev1 212.5 | |||
newoe-10-expire-inactive-ike 205.6 | |||
ikev2-32-nat-rw-rekey 205.4 | |||
</pre> | |||
which can then be turned into a histogram: | |||
[[File:Test-script-time-histogram.jpg]] | |||
=== sleep === | |||
=== ping === | |||
=== timeout === | |||
== Perform Post-mortem == | |||
This seems to be in the noise vis: | |||
<pre> | |||
m1.runner ipsec-hostkey-ckaid-01 12:44:50.01: start post-mortem ipsec-hostkey-ckaid-01 (test 725 of 739) at 2018-10-25 09:40:49.748041 | |||
m1.runner ipsec-hostkey-ckaid-01 12:44:50.03: ****** ipsec-hostkey-ckaid-01 (test 725 of 739) passed ****** | |||
m1.runner ipsec-hostkey-ckaid-01 12:44:50.03: stop post-mortem ipsec-hostkey-ckaid-01 (test 725 of 739) after 0.2 seconds | |||
</pre> | |||
= KVM Hardware = | |||
What the test runs on | |||
== Disk I/O == | |||
Something goes here? | |||
== Memory == | |||
How much is needed? | |||
== CPU == | |||
Anything Here? Allowing use of HOST's h/w accelerators? | |||
= Docker Hardware = | |||
? | |||
= Tuning kvm performance = | |||
Internally kvmrunner.py has two work queues: | Internally kvmrunner.py has two work queues: | ||
| Line 53: | Line 144: | ||
* repeat | * repeat | ||
By adjusting KVM_WORKERS and KVM_PREFIXES it is possible to: | |||
* speed up test runs | * speed up test runs | ||
* run independent testsuites in parallel | * run independent testsuites in parallel | ||
== | By adjusting KVM_LOCALDIR it is possible to: | ||
* use a faster disk or even tmpfs (on /tmp) | |||
== KVM_WORKERS=... -- the number of test domains (machines) booted in parallel == | |||
Booting the domains is the most CPU intensive part of running a test, and trying to perform too many reboots in parallel will bog down the machine to the point where tests time out and interactive performance becomes hopeless. For this reason a pre-sized pool of reboot threads is used to reboot domains: | Booting the domains is the most CPU intensive part of running a test, and trying to perform too many reboots in parallel will bog down the machine to the point where tests time out and interactive performance becomes hopeless. For this reason a pre-sized pool of reboot threads is used to reboot domains: | ||
| Line 86: | Line 182: | ||
Only if your machine has lots of cores should you consider adjusting this in Makefile.inc.local. | Only if your machine has lots of cores should you consider adjusting this in Makefile.inc.local. | ||
== KVM_PREFIXES=... -- create a pool of test domains (machines) == | |||
Tests spend a lot of their time waiting for timeouts or slow tasks to complete. So that tests can be run in parallel the KVM_PREFIX provides a list of prefixes to add to the host names forming unique domain groups that can each be used to run tests: | Tests spend a lot of their time waiting for timeouts or slow tasks to complete. So that tests can be run in parallel the KVM_PREFIX provides a list of prefixes to add to the host names forming unique domain groups that can each be used to run tests: | ||
| Line 146: | Line 238: | ||
Two domain groups (e.x., KVM_PREFIX=a. b.) seems to give the best results. | Two domain groups (e.x., KVM_PREFIX=a. b.) seems to give the best results. | ||
=== Recommendations | Note that this is still somewhat experimental and has limitations: | ||
* stopping parallel tests requires multiple control-c's | |||
* since the duplicate domains have the same IP address, things like "ssh east" don't apply; use "make kvmsh-<prefix><domain>" or "sudo virsh console <prefix><domain" or "./testing/utils/kvmsh.py <prefix><domain>". | |||
== KVM_LOCALDIR=/tmp/pool -- the directory containing the test domain (machine) disks == | |||
To reduce disk I/O, it is possible to store the test domain disks in ram using tmpfs and /tmp. Here's a nice graph illustrating what happens when the option is set: | |||
[[File:Diskstats iops-day.png]] | |||
== Recommendations == | |||
=== Some Analysis === | |||
The test system: | The test system: | ||
| Line 182: | Line 287: | ||
Notice how having more than #cores/2 KVM_WORKERS (here 2) has little benefit and failures edge upwards. | Notice how having more than #cores/2 KVM_WORKERS (here 2) has little benefit and failures edge upwards. | ||
=== Desktop Development Directory === | |||
* reduce build/install time - use only one prefix | * reduce build/install time - use only one prefix | ||
| Line 203: | Line 308: | ||
but that, unfortunately, slows down the the build/install time. | but that, unfortunately, slows down the the build/install time. | ||
=== Desktop Baseline Directory === | |||
* do not overload the desktop - reduce CPU load by booting sequentially | * do not overload the desktop - reduce CPU load by booting sequentially | ||
| Line 214: | Line 319: | ||
* KVM_PREFIX= b1. b2. | * KVM_PREFIX= b1. b2. | ||
=== Dedicated Test Server === | |||
* minimize total testsuite time | * minimize total testsuite time | ||
Latest revision as of 03:11, 11 August 2020
Software - what is run by each test
Boot the VMs
Before a test can be run all the VMs are (re)booted. Consequently one obvious way to speed up testing is to reduce the amount of time it takes to boot:
- make the boot faster - it should be around 1s
- boot several machines in parallel - however booting is CPU intensive (see below for analysis)
To determine where a VM is spending its time during boot, use systemd-analyze blame (do several runs, the very first boot does extra configuration so is always be slower):
$ date ; ./testing/utils/kvmsh.py --boot cold l.east 'systemd-analyze time ; systemd-analyze critical-chain ; systemd-analyze blame'
Mon 10 Aug 2020 09:10:06 PM EDT
virsh 0.00: waiting 20 seconds for domain to shutdown
virsh 0.05: domain shutdown after 0.5 seconds
virsh 0.06: starting domain
virsh 11.07: got login prompt; sending 'root' and waiting 5 seconds for password (or shell) prompt
virsh 11.08: got password prompt after 0.1 seconds; sending 'swan' and waiting 5 seconds for shell prompt
virsh 12.00: we're in after 0.3 seconds!

[root@east ~]# systemd-analyze time ; systemd-analyze critical-chain ; systemd-analyze blame
Startup finished in 1.270s (kernel) + 1.837s (initrd) + 4.448s (userspace) = 7.557s
multi-user.target reached after 4.411s in userspace
The time when unit became active or started is printed after the "@" character.
The time the unit took to start is printed after the "+" character.

multi-user.target @4.411s
└─sshd.service @4.356s +52ms
  └─network.target @4.350s
    └─systemd-networkd.service @1.236s +196ms
      └─systemd-udevd.service @1.003s +229ms
        └─systemd-tmpfiles-setup-dev.service @869ms +102ms
          └─kmod-static-nodes.service @644ms +115ms
            └─systemd-journald.socket
              └─system.slice
                └─-.slice
2.909s systemd-networkd-wait-online.service
 445ms systemd-udev-trigger.service
 443ms systemd-vconsole-setup.service
 229ms systemd-udevd.service
 209ms systemd-journald.service
 196ms systemd-networkd.service
 180ms systemd-tmpfiles-setup.service
 178ms systemd-logind.service
 145ms auditd.service
 138ms source.mount
 124ms testing.mount
 115ms kmod-static-nodes.service
 111ms systemd-journal-flush.service
 110ms tmp.mount
 102ms systemd-tmpfiles-setup-dev.service
  99ms systemd-modules-load.service
  84ms systemd-remount-fs.service
  71ms systemd-random-seed.service
  58ms systemd-sysctl.service
  57ms dbus-broker.service
  52ms sshd.service
  50ms systemd-userdbd.service
  33ms systemd-user-sessions.service
  24ms systemd-fsck-root.service
  23ms dracut-shutdown.service
  21ms systemd-update-utmp.service
  13ms systemd-update-utmp-runlevel.service
   6ms sys-kernel-config.mount
[root@east ~]#
Run the Test Scripts
To establish a baseline, enumcheck-01, which pretty much nothing, takes ~2s to run the test scripts once things are booted:
w.runner enumcheck-01 32.08/32.05: start running scripts west:west.sh west:final.sh at 2018-10-24 22:00:44.706355
...
w.runner enumcheck-01 34.03/34.00: stop running scripts west:west.sh west:final.sh after 1.5 seconds
everything else is slower.
To get a list of script times:
$ awk '/: stop running scripts/ { print $3, $(NF-1) }' testing/pluto/*/OUTPUT/debug.log | sort -k2nr | head -5
newoe-05-hold-pass 295.6
newoe-04-pass-pass 226.7
ikev2-01-fallback-ikev1 212.5
newoe-10-expire-inactive-ike 205.6
ikev2-32-nat-rw-rekey 205.4
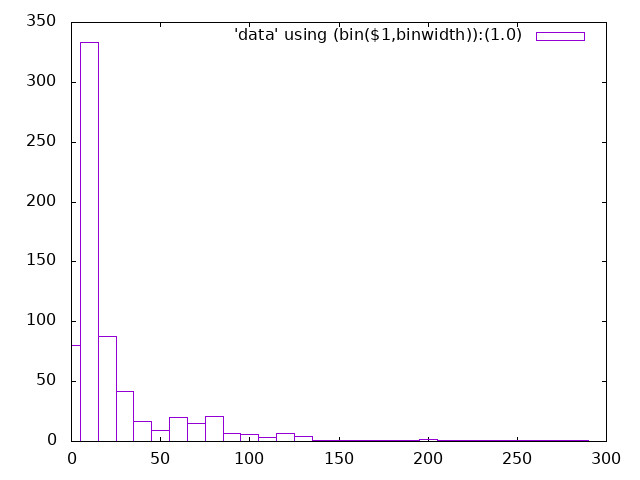
which can then be turned into a histogram:
sleep
ping
timeout
Perform Post-mortem
This seems to be in the noise vis:
m1.runner ipsec-hostkey-ckaid-01 12:44:50.01: start post-mortem ipsec-hostkey-ckaid-01 (test 725 of 739) at 2018-10-25 09:40:49.748041
m1.runner ipsec-hostkey-ckaid-01 12:44:50.03: ****** ipsec-hostkey-ckaid-01 (test 725 of 739) passed ******
m1.runner ipsec-hostkey-ckaid-01 12:44:50.03: stop post-mortem ipsec-hostkey-ckaid-01 (test 725 of 739) after 0.2 seconds
KVM Hardware
What the test runs on
Disk I/O
Something goes here?
Memory
How much is needed?
CPU
Anything Here? Allowing use of HOST's h/w accelerators?
Docker Hardware
?
Tuning kvm performance
Internally kvmrunner.py has two work queues:
- a pool of reboot threads; each thread reboots one domain at a time
- a pool of test threads; each thread runs one test at a time using domains with a unique prefix
The test threads uses the reboot thread pool as follows:
- get the next test
- submit required domains to reboot pool
- wait for domains to reboot
- run test
- repeat
By adjusting KVM_WORKERS and KVM_PREFIXES it is possible to:
- speed up test runs
- run independent testsuites in parallel
By adjusting KVM_LOCALDIR it is possible to:
- use a faster disk or even tmpfs (on /tmp)
KVM_WORKERS=... -- the number of test domains (machines) booted in parallel
Booting the domains is the most CPU intensive part of running a test, and trying to perform too many reboots in parallel will bog down the machine to the point where tests time out and interactive performance becomes hopeless. For this reason a pre-sized pool of reboot threads is used to reboot domains:
- the default is 1 reboot thread limiting things to one domain reboot at a time
- KVM_WORKERS specifies the number of reboot threads, and hence, the reboot parallelism
- increasing this allows more domains to be rebooted in parallel
- however, increasing this consumes more CPU resources
To increase the size of the reboot thread pool set KVM_WORKERS. For instance:
$ grep KVM_WORKERS Makefile.inc.local
KVM_WORKERS=2
$ make kvm-install kvm-test
[...]
runner 0.019: using a pool of 2 worker threads to reboot domains
[...]
runner basic-pluto-01 0.647/0.601: 0 shutdown/reboot jobs ahead of us in the queue
runner basic-pluto-01 0.647/0.601: submitting shutdown jobs for unused domains: road nic north
runner basic-pluto-01 0.653/0.607: submitting boot-and-login jobs for test domains: east west
runner basic-pluto-01 0.654/0.608: submitted 5 jobs; currently 3 jobs pending
[...]
runner basic-pluto-01 28.585/28.539: domains started after 28 seconds
Only if your machine has lots of cores should you consider adjusting this in Makefile.inc.local.
KVM_PREFIXES=... -- create a pool of test domains (machines)
Tests spend a lot of their time waiting for timeouts or slow tasks to complete. So that tests can be run in parallel the KVM_PREFIX provides a list of prefixes to add to the host names forming unique domain groups that can each be used to run tests:
- the default is no prefix limiting things to a single global domain pool
- KVM_PREFIXES specifies the domain prefixes to use, and hence, the test parallelism
- increasing this allows more tests to be run in parallel
- however, increasing this consumes more memory and context switch resources
For instance, setting KVM_PREFIXES in Makefile.inc.local to specify a unique set of domains for this directory:
$ grep KVM_PREFIX Makefile.inc.local
KVM_PREFIX=a.
$ make kvm-install
[...]
$ make kvm-test
[...]
runner 0.018: using the serial test processor and domain prefix 'a.'
[...]
a.runner basic-pluto-01 0.574: submitting boot-and-login jobs for test domains: a.west a.east
And setting KVM_PREFIXES in Makefile.inc.local to specify two prefixes and, consequently, run two tests in parallel:
$ grep KVM_PREFIX Makefile.inc.local
KVM_PREFIX=a. b.
$ make kvm-install
[...]
$ make kvm-test
[...]
runner 0.019: using the parallel test processor and domain prefixes ['a.', 'b.']
[...]
b.runner basic-pluto-02 0.632/0.596: submitting boot-and-login jobs for test domains: b.west b.east
[...]
a.runner basic-pluto-01 0.769/0.731: submitting boot-and-login jobs for test domains: a.west a.east
creates and uses two dedicated domain/network groups (a.east ..., and b.east ...).
Finally, to get rid of all the domains use:
$ make kvm-uninstall
or even:
$ make KVM_PREFIX=b. kvm-uninstall
Two domain groups (e.x., KVM_PREFIX=a. b.) seems to give the best results.
Note that this is still somewhat experimental and has limitations:
- stopping parallel tests requires multiple control-c's
- since the duplicate domains have the same IP address, things like "ssh east" don't apply; use "make kvmsh-<prefix><domain>" or "sudo virsh console <prefix><domain" or "./testing/utils/kvmsh.py <prefix><domain>".
KVM_LOCALDIR=/tmp/pool -- the directory containing the test domain (machine) disks
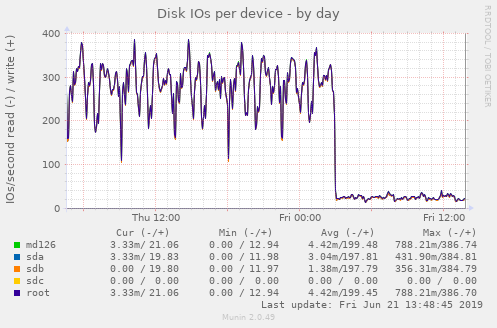
To reduce disk I/O, it is possible to store the test domain disks in ram using tmpfs and /tmp. Here's a nice graph illustrating what happens when the option is set:
Recommendations
Some Analysis
The test system:
- 4-core 64-bit intel
- plenty of ram
- the file mk/perf.sh
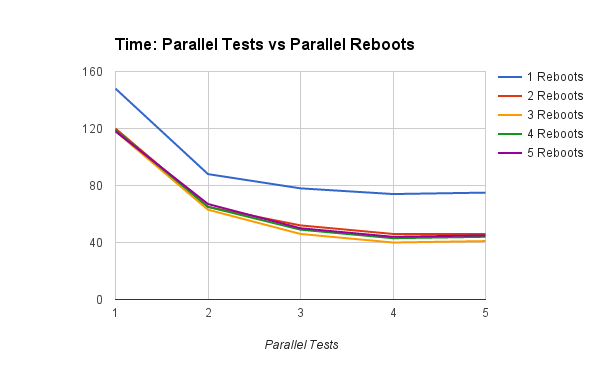
Increasing the number of parallel tests, for a given number of reboot threads:
- having #cores/2 reboot threads has the greatest impact
- having more than #cores reboot threads seems to slow things down
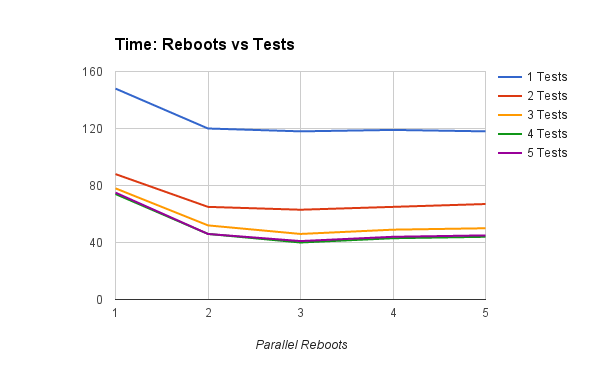
Increasing the number of reboots, for a given number of test threads:
- adding a second test thread has a far greater impact than adding a second reboot thread - contrast top lines
- adding a third and even fourth test thread - i.e., up to #cores - still improves things
Finally here's some ASCII art showing what happens to the failure rate when the KVM_PREFIX is set so big that the reboot thread pool is kept 100% busy:
                  Fails  Reboots  Time
     ************  127      1     6:35  ****************************************
   **************  135      2     3:33  *********************
  ***************  151      3     3:12  *******************
  ***************  154      4     3:01  ******************
Notice how having more than #cores/2 KVM_WORKERS (here 2) has little benefit and failures edge upwards.
Desktop Development Directory
- reduce build/install time - use only one prefix
- reduce single-test time - boot domains in parallel
- use the non-prefix domains east et.al. so it is easy to access the test domains using tools like ssh
Lets assume 4 cores:
KVM_WORKERS=2
KVM_PREFIX=''
You could also add a second prefix vis:
KVM_PREFIX= '' a.
but that, unfortunately, slows down the the build/install time.
Desktop Baseline Directory
- do not overload the desktop - reduce CPU load by booting sequentially
- reduce total testsuite time - run tests in parallel
- keep separate to development directory above
Lets assume 4 cores
- KVM_WORKERS=1
- KVM_PREFIX= b1. b2.
Dedicated Test Server
- minimize total testsuite time
- maximize CPU use
- assume only testsuite running
Assuming 4 cores:
* KVM_WORKERS=2
* KVM_PREFIX= '' t1. t2. t3.


